How Philly Stacks Up to Other Cities — in Practically Everything
What can you tell about a town by its stats? A lot. From bedbugs to traffic jams, here’s how our city compares to the rest of America.
How does Philly compare to other cities? Read this list of Philadelphia rankings to find out.
Research assistance by Samantha Spengler.
Yes, yes, we are the best city in the world. No doubt about it. Who else has Ben Franklin? Bryce Harper? Suraya? Gritty? But sometimes, it’s helpful to widen the lens and get a sense of perspective on how the rest of the universe relates to our town — and vice versa. Not to mention that everything from baseball to politics to health care now runs on analytics. Why not us? So we scoured all the usual and unusual sources to compile a more, um, unbiased view of Our Town in nine different categories — then added four totally biased essays on why we’re tops (or not).
Jump to:
Demographics | Health & Wellness | Crime | Getting Around | Food & Drink | Financial Matters | Education | Sports & Entertainment | Business & Politics

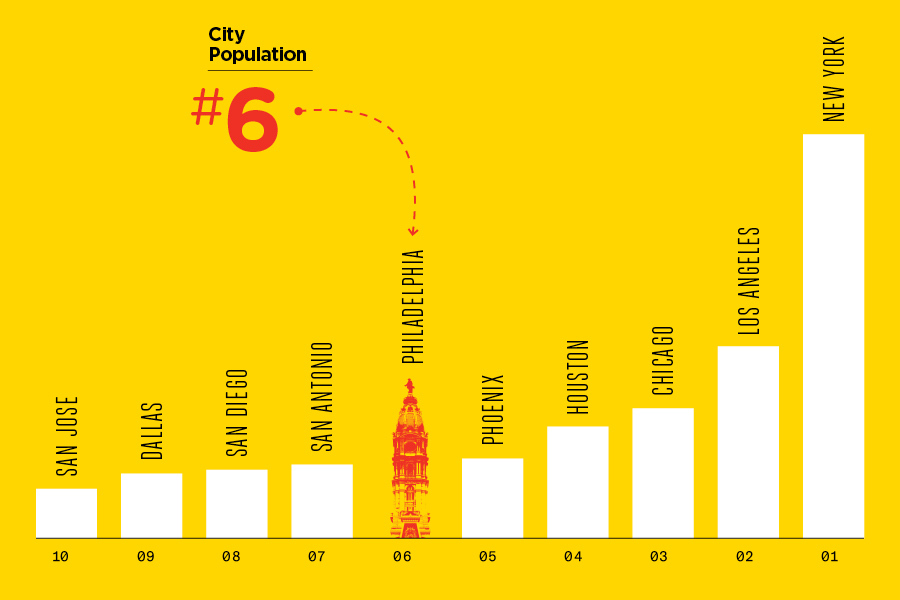
City Population: #6
At 1,584,138 people, we’re only 76,134 residents behind Phoenix, with San Antonio nipping at our heels. Get breeding, everybody! U.S. Census Bureau
Metro Population: #8
Stretching from Reading past Camden and including parts of South Jersey, Maryland and Delaware, we’ve got 6,096,372 total residents in the Delaware Valley. We’re neck-and-neck with Atlanta, just below us, and Miami, just above. NYC puts everywhere else to shame with 19,979,477. But who wants that many neighbors anyway? U.S. Census Bureau
Population Growth: #22
Of the top 25 cities, our 3.8 percent five-year increase beat out Chicago (at .4 percent) but trailed leaders Seattle (22.4), Austin (20.2) and Fort Worth (20.2). U.S. Census Bureau
Median Age: Fifth oldest
We’re tied with New York City for fifth most elderly of the 10 largest U.S. cities, at 34.1 years. The young folks are in Dallas (32.5 years) and Houston (32.9). American Community Survey (ACS)
Race, Age and Income Diversity: #37
That’s out of 226 U.S. cities, so this is nothing to sneeze at. The top three cities when it comes to celebrating differences are all in California: Vallejo, Oakland and San Diego. Niche
Cultural Diversity: #99
This survey looked at “ethnoracial diversity,” “linguistic diversity” and “birthplace diversity.” There’s apparently more variety in Jersey City and the Maryland cities of Gaithersburg and Germantown than here. Fungool. WalletHub
 LGBTQ Population: #27
In our city of about 1.6 million people, Philadelphia’s Office of LGBT Affairs says, some 60,000 Philadelphians identify as lesbian, gay, bisexual, transgender or queer. That comes out to 3.9 percent, just a bit above the national rate of 3.6. In leading metro area San Francisco, it’s 6.2 percent; runners-up Portland, Austin and New Orleans all come in above five percent. We don’t even make the top 25. Gallup
Millennial Population: 13th
Of the nation’s 30 largest cities, Philly had the greatest increase in millennials a few years back, going from 20.2 percent in 2006 to 26.3 percent in 2012. But since then, we’ve stayed the same, while suburbs, particularly in the Sunbelt, have seen an influx of young people. Current highest percentage of millennials: Boston, at 34.6 percent. ACS
Pet-Friendliness: #69
Oof. Don’t bite us, Buster. Based on metrics including costs of owning and caring for a pet here, amenities like pet-friendly restaurants and hotels, and number of dog parks. WalletHub
Percent of Foreign-Born Population: #10
Of the top 10 metro areas, we’re dead last. The areas with the most immigrants are Miami (41.2 percent), Los Angeles (33 percent) and New York City (29 percent). At our immigration peak back in the 1850s, 30 percent of Philly’s population — double what was then the national share — was foreign-born. ACS, Pew Trusts
 Bedbug Infestations: #1
Gather yours up and take them to New York, currently holding at number two. Terminix
Number of Sunny Days Per Year: #125
Yeah, well, what did you expect? The 10 sunniest cities are all in the Southwest, led by Yuma, Arizona, with an average of 90 percent of all possible sunshine each year. It’s followed by Redding, California, at 88 percent, and Las Vegas, Phoenix and Tucson, all tied at 85. We’re way down the list, with only 56 percent of all possible sunshine. That’s not good. Unless you’re growing a lawn. NerdWallet
STD Rates: #3
We’re right behind Baltimore and Jackson, Mississippi, among the nation’s 100 largest cities with the highest rates. May we recommend Condom Kingdom on South Street, people? Centers for Disease Control and Prevention via Innerbody.com
 Spring Allergies: 25th Worst
That’s at the bottom edge of the “Worse Than Average” section of the 2019 list, right before things start to get better. The worst three metro areas are McAllen, Texas; Jackson, Mississippi; and Providence, Rhode Island. Best place of all for not sneezing? Denver, Colorado. Asthma and Allergy Foundation of America
Fatness: #48
Hey, that’s not bad! The biggest (literally) three metro areas are Memphis, Tennessee; McAllen, Texas; and Tulsa, Oklahoma; based on the percentages of all ages that are overweight or obese. Have another Federal Donut, everybody! WalletHub
Overall Fitness: #63
The top three are Arlington, Virginia; Seattle; and Minneapolis. Hmm, nice geographical spread, at least. Us, we’ve got hoagie spread. American Fitness Index
Best Hospital in the Nation: 18th (HUP/Presby)
It’s in a tie for the spot with Phoenix’s Mayo Clinic. Mayo’s home clinic in Rochester, Minnesota, is number one. U.S. News & World Report
Life expectancy: 24th
In other words, we’re next to last of the 25 biggest cities. Our average life expectancy is 75.4 years, compared to overall leader San Jose at 82.4. Man, that’s a whole seven more years of fun. Of the 500 places ranked by NYU’s City Health Dashboard, the longest-lived were Newton, Massachusetts (85.1 years), and San Ramon and Carlsbad, both in California (84.5 and 84.2 years, respectively). Shortest spans? Nihilists should investigate number 25, Detroit (72.4 years), or Gary, Indiana, and Dayton, Ohio (both 72 years flat). Or just stay here. City Health Dashboard
Stress Levels: #5
The good news: We’re way chill family-stress-wise, where we rank 60th. When it comes to work stress, though, we’re number two. The overall most-stressed city is Detroit, followed by Cleveland and Newark, then Baltimore, then us. Least-stressed city ever? Fremont, California. WalletHub
Infant Mortality Rate: #10
That’s of the top 10 major cities. Babies do best in sunny California, led by San Jose (3.3 deaths per 1,000 live births) and San Diego (3.8); then come New York City (4.2) and L.A. (4.4). Philly comes in a lowly last, at 8.3 deaths per thousand births. The national rate is 5.8 per thousand. Centers for Disease Control and Prevention

Photograph by K. Kelly for Visit Philadelphia
Parks Within a 10-Minute Walk: #10
So what if there are a lot of benches in our parks? American Fitness Index
Ozone Pollution: #21
Out of 228 metro areas, we’re number 18 for annual particle pollution. Breathe deeply, Philly. The top six most polluted cities are all in California — L.A., Visalia, Bakersfield, Fresno, Sacramento and San Diego — which probably explains why they’re taking car emissions so seriously. American Lung Association
Residents Without Health Insurance: #5
Of the top 10 cities, Dallas has the most uninsured residents, at 24 percent. We’re eighth with 7.1 percent, a 2.6 percentage point decrease since 2015. ACS

Murder Rate: 4th Highest
We’re up 8.5 percent over 2017, with Baltimore, Detroit and D.C. ahead of us. Brennan Center for Justice
Overall Crime Rate: 20th Worst
The Brennan Center’s list—which looks at the 30 largest cities—relies on police reports of violent and nonviolent crimes and pegs us at 3,936 per 100,000 in 2017. On the plus side: Phoenix, San Antonio, Chicago and Houston are all worse than we are. On the plus-plus side: Our violent crime rate was down 5.3 percent in 2018. Brennan Center for Justice
States With the Most People on Death Row: #6
The federal government has 61 prisoners on death row. Twenty-one states, including our neighbor New Jersey, have abolished capital punishment. Pennsylvania ties with Ohio for sixth place, with 136 prisoners awaiting execution. The leaders are California (738), Florida (339), Texas (217), Alabama (175) and North Carolina (142). State departments of corrections
Registered Sex Offenders: N/A
You guys! You guys! We didn’t even make the list of the top 50! (But Wilmington, Delaware? They’re number one.) Security Baron
Incarceration Rate: #25
The Sentencing Project tracks the number of incarcerated citizens by state per 100,000 residents. Here’s the list: Louisiana, 719; Oklahoma, 704; Mississippi, 619; Arkansas, 598; Arizona, 569; Texas, 553; Missouri, 532; Kentucky, 527; Georgia, 506; Alabama, 486; Florida, 466; South Dakota, 453; Nevada, 451; Idaho, 447; Ohio, 441; Virginia, 437; Wyoming and Tennessee, each 429; Delaware, 420; Michigan, 397; West Virginia, 392; Wisconsin, 391; Indiana, 389; South Carolina, 386; and Pennsylvania, 375. Lowest-ranking states? Massachusetts (120), Maine (134) and Rhode Island (170). The Sentencing Project

Traffic: 9th Worst
We would personally like to dispute this ranking based on our hellish daily commute, but whatever. This one comes from the INRIX Global Traffic Scorecard, which charts hours lost due to traffic and cost of congestion per motorist. The top — well, worst — three are Boston, D.C. and Chicago, with NYC fourth. INRIX Global Traffic Scorecard

Photograph by Jeff Fusco
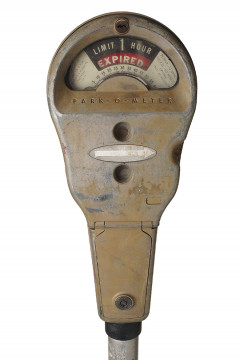 Parking Costs: 4th Highest
Hey, even at an hourly rate of $12, we’re cheaper than Boston, Chicago and number one NYC, where an hour will set you back $27. Parkopedia and Parking Property Advisors
Walkability: #7
Yep, yep, that’s us up there, behind NYC, Jersey City, San Francisco, Boston, Newark and Miami. ACSM’s American Fitness Index
Bike Commuters Per Capita: 7th
We’re at 2.6 percent; Portland pedals hardest, with 6.3 percent. Move.org
Commute: 6th Longest
Ours average 30 minutes, the same as in L.A., Houston and Seattle. In winner (?) NYC, getting to work takes an average of 36 minutes. U.S. News & World Report’s 125 Best Places to Live
Best Cities for People With Disabilities: 28th
Based on everything from insurance rates and number of health-care providers to wheelchair accessibility and employment rates. Best of the rest: South Burlington, Vermont; Scottsdale, Arizona; and St. Louis, Missouri. WalletHub
Hot Take: Philadelphia Is the Best City for Walking
Cities Where Bike Commuting Is Growing Fastest: #5
Up 125 percent from 2006 to 2017! League of American Bicyclists
Driving Ability: 11th Worst
There are worse drivers than youse guys? Hard to believe. But yeah, Baltimore comes in at number one on Allstate Insurance’s latest ranking of 200 cities, which is based on accident rates. And guess what the most dangerous road in our region is? All together now: Roosevelt Boulevard! Allstate Insurance
 On-Time Flights: 8th Best
Through June of this year, PHL had an on-time departure rate of 80.7 percent. Where you’ll get stuck longest: Chicago’s Midway (65.7 percent), Newark (70.8 percent) and Dallas (71.3). MarketWatch
Schuylkill Expressway: 6th Most Congested Stretch of U.S. Road
Wow, will you look at that! If it’s part of your commute (it’s part of ours!), you lost 53 hours of your life sitting there this year. But hey, chin up! The worst traffic in the world is in Moscow, Russia. INRIX Global Traffic Scorecard
Lane Miles of Bike Lanes: ~400
Lane Miles of Protected Bike Lanes: ~5
San Francisco has 20 protected lane miles. New York City has 126. Just sayin’. The Bicycle Coalition
Citizens Who Take Public Transportation to Work: 9th
Across the 100 biggest American cities, only 7.1 percent of residents overall use public trans. In Philly, it’s 24 percent — and that’s the third highest percentage among U.S. cities with more than a million citizens. The top three: NYC, Jersey City and Boston. Pew Trusts

White American Cheese Consumption: #1
We eat half of all the white stuff Kraft makes — not to mention a quarter of all its Cheez Whiz. It’s the cheesesteaks, yo. Kraft Foods
Pizza Consumption: #9
The data comes from Uber Eats, so … Also? That data says our favorite pie is Papa John’s, which is a goddamn lie. Top three pie-eating places: San Francisco, L.A. and Miami. Uber Eats
Bacon Consumption: #6
And we are not ashamed! The number one baconator is NYC, trailed by L.A. and San Antonio. And speaking of pigs, we’re the only city that eats scrapple. American Meat Institute
Hot Dog Consumption: #3
Cheesesteak, schmeesesteak; give us the tube steak! We eat more than 15 million pounds of wieners per year, right behind New York and number one Los Angeles. National Hot Dog & Sausage Council
James Beard Award winners, 2009-2019: #4
That’s the good news. The not-so-good news: Our eight winners in the Best Restaurant and Best Chef categories put us well behind New York City (84), Chicago (31) and San Francisco (28). Well. Nowhere to go but up! James Beard Foundation
Hot Take: Philly Is the Worst City in Which to Open a Restaurant
Percent of Annual Budget Spent on Food: #8
We’re shoveling 12.6 percent of all we spend into our maws. Honolulu leads the nation at 18.1 percent, but it has the excuse of remoteness. After that, it’s Tampa (14.3), Seattle (13.4), Chicago and San Diego (tied at 13.3), and us, Anchorage and San Francisco in another tie. Bureau of Labor Statistics
Biggest Convenience-Store Chain in North America: 9th (Wawa)
You may think there are a lot of Wawas, but you know what there are really a lot of? 7-Elevens. Nine thousand seven hundred of them, in fact, thanks to the 1,000 stores they bought from Sunoco last year. They’re followed closely by a Canadian outfit known as Alimentation Couche-Tard, which we think translates to “Eat and then sleep late,” with 8,389 stores; number three is Speedway, headquartered in Ohio, with 3,900. Wawa’s 850 or so stores rank lower than the EG Group, which owns Turkey Hill and Tom Thumb, and even BP, which goes to show that size is a matter of perspective. Convenience Store Products Magazine
Healthy Eating: #104
We’re sort of torn about this ranking, frankly. I mean, we’re trying to do better and lay off the soft pretzels. On the other hand, who wants to live in top three Naples, Florida; Barnstable Town, Massachusetts; or Santa Cruz, California? Did you ever try to track down a Wiz Wit’ in Barnstable Town? Gallup and Sharecare
 Caffeination Rate: #13
Ooh, ooh, we’re so excited about this one, indeed we are! Pour us another cup! Now! DO IT NOW!!! Included in the scoring: Total number of coffee shops, coffee shops per capita, annual sales, and average price of a cappuccino. The top three are Portland, Oregon, San Francisco and Seattle. Bestlifeonline.com
Ice-Cream Shops: #6
We thought they’d all be in beachy places, but no. Per capita, number one is the Youngstown, Ohio, metro area, followed by Portland, Maine, and Daytona Beach, Florida. Scranton’s number four, by the way, and Pittsburgh is seventh. Home state pride! Food & Wine

 Wage Tax Bite: #2
Philly had the first municipal wage tax in the country (since 1939, baby!), and we’re still collecting that tax, made possible by a law intended to help the city recoup from the Great Depression. Our current personal wage tax rate of 3.8712 is the second-highest in all the land (though it has come down a bit from 4.96 percent in 1985). Leading us by a hair is New York City, with a top-tier rate of 3.876 percent. Of the remaining top 25 cities, only Columbus, Ohio (2.5 percent), Detroit (2.4 percent) and Indianapolis (2.02 percent) even have personal wage taxes. (There’s also hybrid D.C., which is sui generis.) And ours isn’t going away; for 2020, it accounts for $2.2 billion of the Mayor’s proposed $4.898 billion budget, dwarfing the number two contributor, $713 million in real estate taxes. Business Insider, Philadelphia Inquirer
Median Home Price: #54
Say hello to $200,146. If that sounds like a lot, the median in San Jose is $1,080,017, followed by San Francisco at $768,517 and Santa Rosa, in Cali’s wine country, at $629,917. U.S. News & World Report’s 125 Best Places to Live

Median Household Income: #24
That’s of the 25 most populous cites. We’re at $42,837 a year, well behind front-runners San Jose (at $100,675), San Francisco ($100,262) and Seattle ($82,868). We do come in ahead of Detroit ($28,994). ACS
Median Household Income Growth: #10
We saw just a 3.3 percent increase from 2013 to 2017 (adjusted for inflation). Best cities for growth? Go West: The winners are San Francisco (20.4 percent), Seattle (15.2 percent) and Denver (12.9 percent). ACS
Average Monthly Rent: #26
That would be $1,075 here, compared to $1,940 in top-ranked San Jose, California, and $1,673 and $1,653 for runners-up San Francisco and Honolulu, respectively. U.S. News & World Report
Poverty Rate: #1
After the Census Bureau confessed in September that it had mangled Philadelphia’s figures, the revision showed our poverty rate at 24.5 percent, down from 26.7 percent in 2014. But we’re still by far the poorest of the nation’s 20 biggest cities. The national rate is 11.8 percent. U.S. Census Bureau
Reduction in Share of Population in Poverty: #10
Our share went down a scant 2.6 percent from 2013 through 2017, adjusted for inflation. Doing the best job of curbing poverty, of 10 selected peer cities: Miami (-13.7 percent), Charlotte (-12.9 percent) and Atlanta (-10.4 percent). Chamber of Commerce
 Unemployment Rate: 268th
That’s out of 389 metro areas. But it’s kind of misleading because there are so many ties on the government’s list; our 4.3 percent unemployment rate is shared by 16 other areas. The most-employed region is Portland, Maine (1.7 percent); at the very bottom is El Centro, California (22.1 percent). Bureau of Labor Statistics
Income Inequality: #3
Only Atlanta and New Orleans are better. Worse, rather, with higher Gini indexes. In Atlanta, about 18 percent of households earn $150,000 a year or more; 9.3 percent make less than $10,000. In Philly, those numbers are 8.2 percent and 19.5 percent, respectively. Bloomberg
Cost of Living: #20
First among the 66 largest U.S. cities: Mountain View, California, which just happens to be the home of something called Google. It’s followed by Palo Alto, where Google first started out (as did Facebook and PayPal), then NYC, San Francisco, Oakland and San Jose. Expatistan.com

Mid-Career Teacher’s Salary: #5
The Philly metro area’s $58,154 trails leader Los Angeles ($71,329), New York City ($67,975) and D.C. ($64,324) but stacks up well against Miami ($43,754) and Atlanta ($49,949) at the bottom end. USA Today
Per-Pupil Spending: #18
Of the nation’s 100 largest school districts, Philadelphia’s $11,741 in FY 2017 ranked 18th. At the head of the line was New York City, at $25,199 — which didn’t keep 59 and 62 percent of its students from failing reading and math, respectively. Trailing just behind NYC was Boston ($22,292), followed by Baltimore ($16,184). U.S. Census Bureau Annual Survey of School System Finances

2nd-Highest-Paid Private-College President: Amy Gutmann
Penn prez Amy Gutmann just raked in $3.9 million. The only guy ahead of her is Columbia’s Lee Bollinger, at $4.6 million. You’d think their football teams would be better. Speaking of which, Penn State’s Eric Barron is third on the public-school list, making $1,854,881. We are! Chronicle of Higher Education
Growth in Young College Grads: #2
Though the city’s population only grew by four percent from 2000 to 2017, we clocked a super-healthy 115 percent increase in college grads ages 25 to 34. That’s good for second place among peer cities, behind only Washington, D.C., at 129 percent, and ahead of third-place Denver with 109 percent. The national rate was 47 percent. Philadelphia Inquirer and Campus Philly
$62,232
Average annual cost to attend one of our region’s 25 most expensive colleges and universities, up 40 percent from 2009. Most costly: Penn, at $71,715 a year. (Bragging rights: priceless.) Philadelphia Business Journal
Residents With High-School Diplomas: #4
Of the nation’s top 10 cities, we make a solid showing at 83.3 percent, trailing super-smart San Diego (87.9 percent), Chicago (83.8) and San Jose (83.5). ACS
Residents With Bachelor’s Degrees: #9
Out of the top 10 cities, we’re second to last, with 27.1 percent. Tops is San Diego again, with 44.4 percent, followed by San Jose (41.3) and Chicago (37.5). ACS
Residents With Professional/Graduate Degrees: #8
At 10.1 percent, we lag behind winner San Diego’s 18.1 percent. We’re still ahead of Phoenix (10 percent) and San Antonio (9.1), though. ACS
How Do Our Colleges Measure Up?
- Penn: 6th Best National University
Penn tied at that spot on the latest U.S. News & World Report list with the University of Chicago and Stanford, behind the top five: Princeton, Harvard, and three more schools that all tied for third: Columbia, MIT and Yale. Villanova’s tied with Wisconsin at 46, while Penn State’s at 57, tied with a whole bunch of schools. The University of Delaware ties with five more schools at 91, and Drexel just barely squeaks into the top 100, tying with six other schools at number 97. U.S. News & World Report - Swarthmore: 3rd Best National Liberal Arts College
Tied with Wellesley, trailing Williams and Amherst. Other local schools on the latest U.S. News list: Haverford at number 11, Bryn Mawr at 27, and Ursinus at 82. U.S. News & World Report - Community College of Philadelphia: 694th Best Community College
Out of 710, in case you were wondering. Rankings are based on three main “dimensions”: cost and financing, education outcomes and career outcomes. Yikes. WalletHubReturn to top
 Percent of Residents Still Watching Old-Fashioned TV: #20
It’s back to the future! While most U.S. homes still subscribe to pay TV — either cable or satellite — an increasing number of us are relying on good ol’ over-the-air (OTA) TV, often paired with subscription video-on-demand streaming. It’s Northeasterners like us who are more likely to cling to cable. In leader Phoenix, a full 24.9 percent of homes are getting OTA TV; it’s trailed by Dallas (23.1 percent) and Minneapolis (22.9). With 10 percent OTA, we’re just ahead of Seattle and just behind San Francisco. Nielsen
Number of Homes With TV Sets: #4
These are out of what Nielsen calls “Designated Market Areas,” or DMAs. First is New York City, with 6,824,120 “TV Homes,” or 6.377 percent of the U.S. total; next come Los Angeles (5,145,350/4.808) and Chicago (3,256,400/3.043), and then us, at 2,758,330 TV Homes, or 2.578 percent of the whole pie. Nielsen
Top 5 TV Shows* by Metro Area, January-September 2019, via Nielsen
Philadelphia
1. Jeopardy
2. This Is Us
3. Dancing With the Stars
4. The Big Bang Theory
5. Wheel of FortuneNew York
1. Jeopardy
2. This Is Us
3. The Big Bang Theory
4. Wheel of Fortune
5. Grey’s AnatomyChicago
1. Chicago Fire
2. Chicago P.D.
3. The Bachelor
4. This Is Us
5. The Good DoctorLos Angeles
1. This Is Us
2. America’s Got Talent (Tuesdays)
3. Dancing With the Stars
4. The Bachelor
5. America’s Got Talent (Wednesdays)Atlanta
1. The Masked Singer
2. The Bachelor
3. American Idol
4. 9-1-1
5. The Good DoctorHouston
1. All Rise
2. NCIS
3. America’s Got Talent: The Champions
4. The Big Bang Theory
5. America’s Got Talent (Wednesdays)*That’s right. No cable shows on any of the lists. Go figure.
 Most Popular Cities in the World for Movie Making: #15
We have one man to thank for this rating: Sylvester Stallone, who makes us look all moody and gritty. New York City comes in first, followed by Los Angeles. Thetravel.com
Best Cities for Musicians: #9
That’s to be one, not to see one. Ranker
Most Miserable MLB Fans: #20
ESPN’s “Sports Misery Index” factors in, among other things, championships, playoff berths, playoff wins and heartbreaks, and rival comparisons — when your most loathed enemies win big-time — with bonus demerits for teams that have gone 25 seasons or more without a championship. Buck up, Phillies fan: You could be cheering for the Padres, the Reds or the White Sox. ESPN
Hot Take: Philadelphia Is the Best City for Sports Fans
Most Miserable NFL Fans: #27
That’s what a Super Bowl win will do for ya, right? Most miserable are no surprise: the Bills, the Browns and the Jets. ESPN

Greatest Male Athlete of All Time: 8th (Wilt Chamberlain)
Wilt the Stilt’s in proud company, according to Bleacher Report. Number seven is Jim Thorpe; then come Pele, Muhammad Ali, Babe Ruth, Wayne Gretzky, Hank Aaron, and Michael Jordan at number one. Other Philly folks on the list: Kobe Bryant at 39, Reggie White at 34, and Pete Rose at 24. Bleacher Report
Most Miserable NBA Fans: #11
Bust the Process! Even with all we’ve been through, we’re happier than Kings, Suns and Hornets fans, who scrape the bottom of the misery barrel. ESPN
Most Miserable NHL fans: #10
Count your blessings, dammit. We’ve got Carter Hart, and we’re much happier than fans of the Panthers, Sabres and Coyotes. ESPN

Rising Cities For Start-Ups: #8
That doesn’t sound terrible, except this ranking excluded the 10 metro areas with the most venture capital money. Cheaper costs, higher education levels, college presence, entrepreneurship rates … check, check, check, check! The top three were Columbus, Ohio, St. Louis and Atlanta. Forbes
 Mayoral Salary: #5
Jim Kenney is the fifth-best-paid big-city mayor in the country, with his $218,474 salary trailing overall winner London Breed of San Francisco by more than $82,000. (We think they pay London Breed more just for the cool name.) Amazingly, Kenney isn’t even the best-paid City of Philadelphia employee; he only comes in ninth, behind a bunch of medical examiners, the airport’s CEO, and the police commissioner. The Business Journals
Amount of Venture Capital Invested: #11
Just barely out of the top 10 among metro areas, with $5.7 billion invested between 2010 and 2017, trailing Austin with $8 billion. The numbers drop off abruptly after first-place San Francisco, where investors have sunk $144.3 billion; second-place New York City has just $54.5 billion. Pitch Book
Highest-Paid CEO: 24th (Brian Roberts)
We regret to report that our very own top earner, Comcast’s Brian Roberts, who raked in $29,330,869, is a slacker compared to top earner Elon Musk, with $2,284,044,884. New York Times

Brian Roberts. Photograph by Jonathan Pushnik
Federal Public Corruption Convictions, 1976 to 2017: #7
The count is by judicial district, but we’re giving you the major city in each district, so the winner is … Chicago, with 1,731 corrupt pols in those 40 years! Close behind comes Los Angeles, with 1,534, and New York City, with 1,327. We’re small-time with just 1,009. But if you look at the most recent convictions — from 2010 to 2017 — we move up to sixth place. The overall winner for that time span is Richmond, with 296. University of Illinois at Chicago/U.S. Department of Justice
Hot Take: Philadelphia is the Worst City for Politics
Cities Voting Most Heavily Democratic in the 2016 Presidential Race: 4th (tied)
1. San Jose
Percent Voting for Clinton: 72.92. Los Angeles
Percent Voting for Clinton: 66.63. Chicago
Percent Voting for Clinton: 63.74. Philadelphia
Percent Voting for Clinton: 61.64. New York City
Percent Voting for Clinton: 61.66. San Diego
Percent Voting for Clinton: 56.67. Houston
Percent Voting for Clinton: 47.58. San Antonio
Percent Voting for Clinton: 47.29. Phoenix
Percent Voting for Clinton: 44.5Companies Ranked in the Top 50 of the Fortune 500: 2nd
New York City, as usual, leads the pack, with eight. But! Our metro area tied for second with Chicago, Dallas, San Jose and Seattle; we’ve all got three. For the curious, ours would be AmerisourceBergen at 10 (up two spots from 2018), Comcast at 32 (up one spot from 2018), and DuPont at 35 (up a whopping 12 spots). In all, we had 14 companies place on the list of 500 this year. Fortune
Best-Run Cities: #137
Frankly, we’re surprised we weren’t dead last. (Hi to our good friend Mayor Kenney!) But Washington, D.C., had the honor, and we really can’t argue with that. Super-efficient: Nampa, Idaho; Provo, Utah; and Boise, Idaho. Hell, anyone can run a city in Idaho. WalletHub
Unless otherwise noted, all categories are the most recent statistics available for American cities.
Photograph of Stallone by Associate Press, photograph of Kenney courtesy the City of Philadelphia, other images by Getty Images.
Published as “How Philly Stacks Up” in the December 2019 issue of Philadelphia magazine.