
InfoGraphic: The United States of Marriage Equality
Gay marriage maps have been lighting up over the past few weeks.
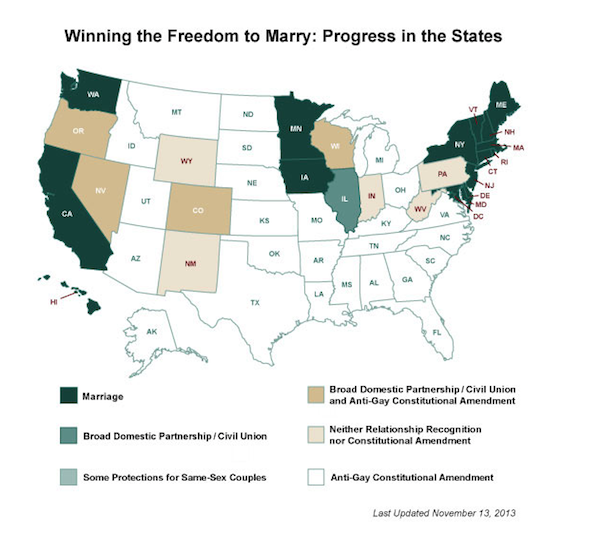
This is what marriage equality looks like now that Hawaii and New Jersey have become the most recent states to legalize gay marriage. The new additions make 16 same-sex marriage states, which, according to CNN, means that “more than 1 in 3 Americans live where same-sex marriage is legal. It’s a dramatic shift in a short period of time — one not seen on other social issues.”
The infographic from Freedom to Marry sadly shows Pennsylvania not only almost completely surrounded by winners, but on a bottom rung with states that have “neither relationship recognition nor a constitutional amendment.” The org also shares some enlightening statistics on our state and beyond:
- According to The Williams Institute’s analysis of the 2010 U.S. Census, 22,336 same-sex couples are living in Pennsylvania, representing 4.5 same-sex couples per 1,000 households.
- In Pennsylvania, 39 percent of the population say they believe marriage should be legal for same-sex couples, with 48 percent opposed. Last fall, the spread was 36-52.
- Over 35 percent of the U.S. population lives in a state that either has the freedom to marry or honors out-of-state marriages of same-sex couples.
- Over 41 percent of the U.S. population lives in a state with either marriage or a broad legal status such as civil union or domestic partnership.
- Over 43 percent of the U.S. population lives in a state that provides some form of protections for gay couples.
Source: Freedom to Marry

