25 Stats That Show How Black People Are Really Doing in Philly
As we celebrate Black History Month, here’s a snapshot of where black Philadelphia is now and why the fight for equity is still far from over.
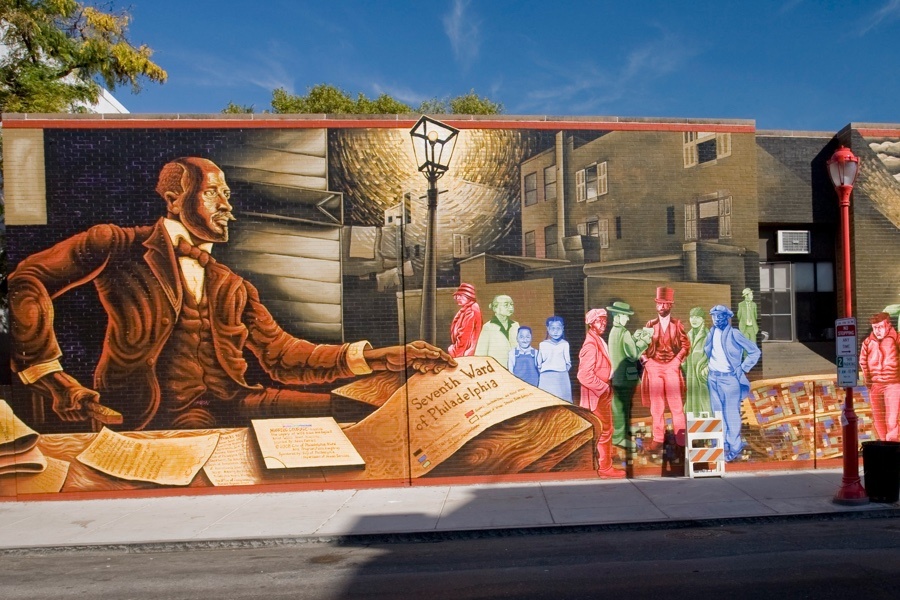
Philadelphia’s commemorative mural of W.E.B. Du Bois | Photo by Steve Weinik
After closely studying and documenting the living conditions of black Philadelphians at the end of the 19th century, sociologist and activist W.E.B. Du Bois declared in the groundbreaking study The Philadelphia Negro, “The Negro is here to stay.”
Du Bois’s deep analysis of Philadelphia’s 7th Ward, which then had the country’s largest population of black people outside the South, contained first-time insights on family life, schooling and health and showed how the circumstances of the black community were tied up in social and historical causes like slavery, racism and discrimination. While Du Bois recognized a troubling situation for black people looking to assume jobs, decrease crime, and maintain their health and family structure, he also expressed hope:
Even with the terribly adverse circumstances under which Negroes live, there is not the slightest likelihood of their dying out; a nation that has endured the slave-trade, slavery, reconstruction, and present prejudice three hundred years, and under it increased in numbers and efficiency, is not in any immediate danger of extinction.
Du Bois was right. We are still here. And today, black Philadelphians, just over 120 years after the publication of his seminal work, have made remarkable progress — though many of the conditions he documented still persist.
As we celebrate the black community’s legacy and promise this Black History Month, here’s a look at look at some statistics that capture the state of black Philadelphians today and why we need continued action.
Population
- According to the latest Pew State of the City report, black people make up 41 percent of Philadelphia’s population.
- While the demographic makeup of Philadelphia has shifted dramatically in the past 30 years, the black population is the only group that has remained relatively stable. In comparison, the white population dropped from just over half in 1990 to about a third in 2017, according to Pew. Meanwhile, Hispanics and Asians have more than doubled their shares of the city’s population.
Employment
- The 2018 U.S. Census American Community Survey found that the labor force participation rate for black Philadelphians ages 16 and older (at a population size of 511,861) was 59 percent. This figure includes those working and those actively looking for employment. The unemployment rate for black Philadelphians, which only accounts for those who are in the labor force, was 13.8 percent that year. In comparison, the labor force participation rate for white Philadelphians ages 16 and older (at a population size of 474,426) that year was 64.5 percent, with unemployment at a rate of 3.8 percent.
- Philadelphia Works, the city’s workforce development board, in 2016 conducted a study of Philadelphia’s working poor — people who work 27 weeks or more in a year but remain below the poverty line. The study revealed that black Philadelphians were twice as likely as their white counterparts to be working poor. (The working poor rate of black people was 10 percent.) “Notably, 22,980 blacks who were classified as working poor accounted for 43 percent of all working poor workers living in Philadelphia (53,053),” the report said. Many of the working poor described in the report worked part-time, had lower wages (an average income of $9,156), had multiple children (between two and 11), and were the only workers in their family compared to the group identified as “the non-poor” — those who worked at least 27 hours per week and stayed above the poverty line.
Education
- The on-time graduation rate for black Philadelphia high-school students in 2018 was 60.6 percent — the second lowest rate behind Hispanics, at 55.6 percent. In comparison, on-time graduation rates were highest among Asian Philadelphians, at 85.1 percent that year.
- The School District of Philadelphia’s snapshot of teacher demographics on October 31, 2019, revealed that black people make up 24.5 percent of the district’s teacher and counselor force. White people make up 66.5 percent.
- Pew’s 2019 State of Education in Philadelphia report found that only 28 percent of Philadelphians 25 or older have at least a bachelor’s degree. The report also revealed that the geographic differences in educational achievement in Philadelphia are stark. In Chestnut Hill, parts of University City and Center City, more than 75 percent of adults have bachelor’s degrees or higher. Yet in parts of Southwest, West and North Philadelphia, the percentage of adults with those degrees is below 25 percent.
Poverty
- The Department of Public Health’s recent Health of the City report found that about a fourth of Philadelphians live in a household with an income below 100 percent of the federal poverty line in 2018. And while poverty rates have decreased for all groups except white people, black Philadelphians are still about “twice as likely to live in poverty” as white Philadelphians, with poverty highest in North and West Philly.
- For black children, the poverty rate was 38 percent in 2018 (in comparison, the poverty rate for white children was 15.9 percent); for black Philadelphians overall, the rate was 29.4 percent.
Health
- The health report found that black Philadelphians had the highest death rate of any group in 2018. Plus, life expectancy outcomes were poorer for black Philadelphians. That expectancy was shortest for black men, at 68.8 years. In comparison, life expectancy at birth was 74.1 years for white men, 74.7 years for Hispanic men, and 86.9 years for Asian men.
- Life expectancy at birth for black women was 77.8 years in 2018, lower than for white women (79.9 years), Hispanic women (84.9 years), or Asian women (93.2 years).
- About one in five adults had a diagnosed depressive disorder in 2018, nearly double the number 15 years before that. But black Philadelphians had the lowest rate of diagnosed depressive disorder among adults, at 20.1 percent. Hispanics had the highest, at 27.9 percent.
- In 2018, black men had an age-adjusted suicide death rate of 11.3 percent per 100,000, while black women had a rate of 3.4 percent. In comparison, white men, who ranked highest, had a rate of 20.8 percent per 100,000. The rate for white women was 7.6 percent.
- While blacks scored better than Hispanics and whites on negative health behaviors like cigarette smoking, e-vapor use among teens, and binge drinking, they scored worse on consumption of sweetened beverages.
- Black girls ages five to 18 had poorer outcomes for obesity than all other groups in Philadelphia. In 2016, black girls had a rate of 23.8 percent, and black boys had a rate of 20.4 percent. Citywide, boys had a 22 percent rate and girls had a 21.8 percent rate.
- Overall, black Philadelphians have the poorest outcomes of all racial groups for obesity and hypertension in adults, diabetes, and childhood asthma hospitalizations.
Food Access
- A recent report on food access in Philadelphia found that more than 980,000 Philadelphians live in neighborhoods with an overabundance of unhealthy food. Most of these people are black, at 45 percent, followed by white (27 percent) and Hispanic (17 percent).
Housing
- Philadelphia continues to be segregated by race: “One race or ethnic group represents the majority in 84 percent of the city’s 381 census tracts,” according to the recent health report. The same report found that access to safe outdoor recreational spaces —“essential for regular exercise” — was greatest in the Northwest and Center City and lowest in North Philadelphia and the Lower Northeast.
- The report also looked at housing code violations “as a proxy for measuring housing quality in the city.” For 2018, 145.5 violations per 1,000 occupied housing units were issued, the report states, with rates the highest “in low-income neighborhoods, particularly in North Philadelphia.”
- According to the city’s Office of Planning & Development, 60 percent of Philly First Home down-payment assistance grants go to black households; 78 percent of users of the heater hotline program (which provides free emergency heater repairs for eligible households) are black; 78 percent of users of the basic systems repair program (which provides free repairs to address electrical, plumbing, heating and other emergencies) are black; and 77 percent of users of the adaptive modifications program (which provides low-income Philadelphians with free mobility adaptations to their homes) are black.
Homelessness
- According to the most recent data snapshot from the city’s Office of Homeless Services, black people are overrepresented in the homeless population. The report looked at data from July 1, 2018, to June 30, 2019, and found that black Philadelphians represented 79 percent of people served in housing crisis and assistance programs in fiscal year 2019, but made up only 44 percent of the city’s overall population.
Criminal Justice and Crime
- Philadelphia’s November 2019 jail population report, part of the MacArthur Foundation’s Safety and Justice Challenge, provides detailed information about the city’s jail population. The report found that from July 2015 to November 2019, the number of black Philadelphians in jail decreased from 5,456 to 3,323, though black people’s share of the jail population increased from 67.5 percent to 69.8 percent. Black people were the only group to experience an increase in the share of the total jail population during that time period.
- The average length of stay for black Philadelphians in jail decreased during that time from 216.5 days to 187.9 days. In November 2019, black people made up 77.7 percent of the “over one year” stay group.
- The city’s health report found that the homicide mortality rate was highest among black Philadelphians — almost 10 times higher than for whites and double the rate among Hispanics.
- Gun violence is the leading cause of death among black men ages 15 to 34. According to a recent city study of the health of black men and boys in Philadelphia, “Most victims and perpetrators of gun violence have complex personal histories, involving substance abuse, mental health conditions, and adverse childhood experiences, and are often exposed to poor socioeconomic and environmental conditions, all of which results in extreme trauma and contributes to or mediates their involvement in community violence.”