Philly Lawmakers Are Making Even More Money Than Before

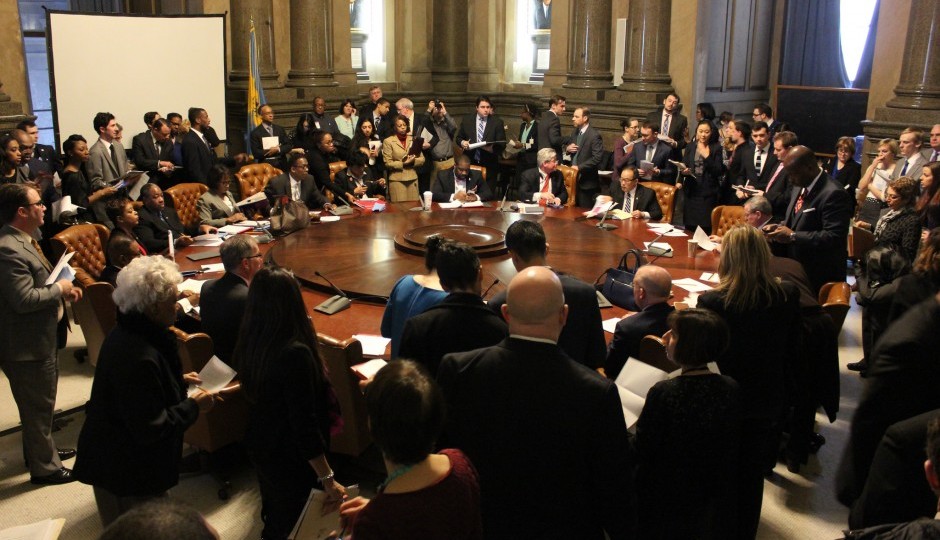
Philadelphia City Council | Photo Credit: City Council’s Flickr page
Back in 2011, the Pew Philadelphia Research Initiative studied how Philadelphia’s City Council compared to other legislatures in 14 peer cities throughout the country. At the time, Philly’s lawmakers had the longest average tenure of all 15 cities and earned the fourth-highest salaries. They also looked an awful lot like Philadelphia, with a ratio of African-Americans that closely matched that of the city’s population as well as the second-highest percentage of women members (41 percent).
Since that report, an election has brought several fresh faces to Council. That, in turn, led Pew to revisit the 2011 study and do a little updating of its findings.
The new analysis looked at three specific categories: lawmakers’ average length of time in office, their salaries, and the proportion of women in each body. The most dramatic change was in longevity: Several resignations, retirements and election defeats caused the average tenure of a Philly lawmaker to fall from 15.5 years in 2011 to a 8.2 years in 2016. That was large enough to knock Philly off its perch as the longest-serving City Council of the 15 legislatures, but it fell only two places, to third.
From 2011 to 2016, Philadelphia’s City Council also went from being the fourth-highest paid legislature in the group to the third-highest paid, edging past New York. Thanks to annual cost-of-living adjustments, the average Philly lawmaker now makes $132,789, compared to $121,107 in 2011. Then as now, Los Angeles’ legislators are the best-paid in the 15 cities by a long shot, earning an average of $178,789 in 2011 and $189,041 now. The Pew researchers attributed some of the higher pay to heavier lifting: The legislatures in both Philadelphia and Washington, which is home to the second-highest paid Council, perform some of the duties of a county government. Washington’s Council fulfills some state government functions, too.
The percentage of women on Philadelphia’s City Council, and its rank in this category, also fell over the last five years. The drop illustrates what a difference small changes can make in a relatively small body. Women now make up 35 percent of the members on Philadelphia’s 17-member City Council, a drop of six percentage points from 2011, when the city had the second-highest percentage of women lawmakers. Now Philly ranks fifth. The changes result from a net loss of one woman member in the wake of the 2015 city elections. As most of the 15 legislatures studied have 17 or fewer members, similar small changes also resulted in big movement up and down the scale in this category.
What does all this mean in terms of Council’s effectiveness, and whether or not Philadelphians are getting their money’s worth? As this year’s study did not look at some statistics included in the original report, such as the cost-per-resident of running the Council, it’s difficult to say. But the figures do suggest that, given the extra functions they perform, Philly’s Council members may be somewhat justified in their pay. Also, the injection of new blood on City Council not only brings Philadelphia’s average tenure more in line with its peers, but it also holds the promise of providing fresh ideas to solve the city’s problems.
Pew’s analysis originally included a typo regarding the average 2011 salary for a Philadelphia lawmaker. This post has been updated to include the correct figure.
Follow Sandy Smith on Twitter.