The 50 Hottest Philadelphia Neighborhoods and Nearby Towns
Your guide to the hottest Philadelphia neighborhoods and nearby towns / Photograph via Getty Images
Did your neighborhood make the cut? Here’s a list of the Philadelphia region’s priciest places* and most expensive neighborhoods in 2022.
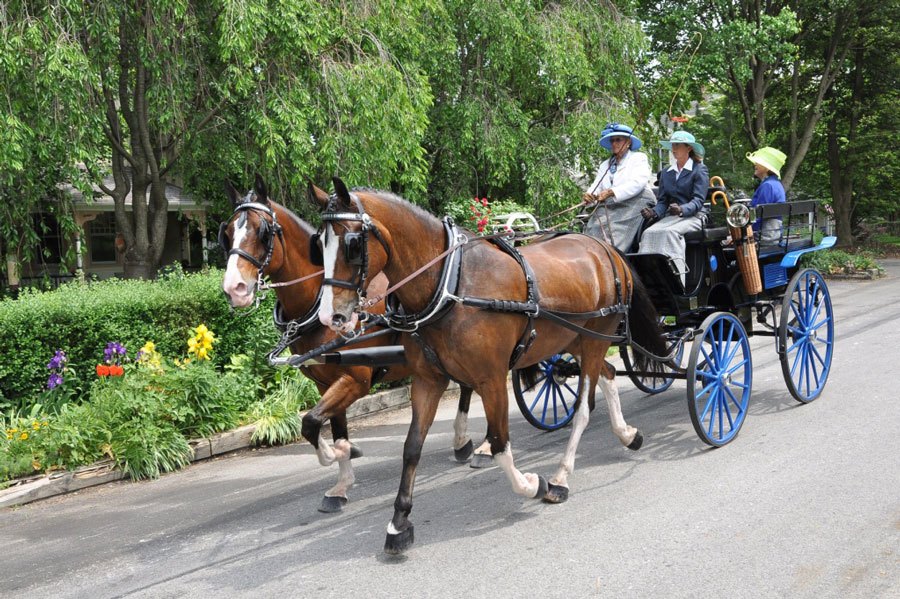
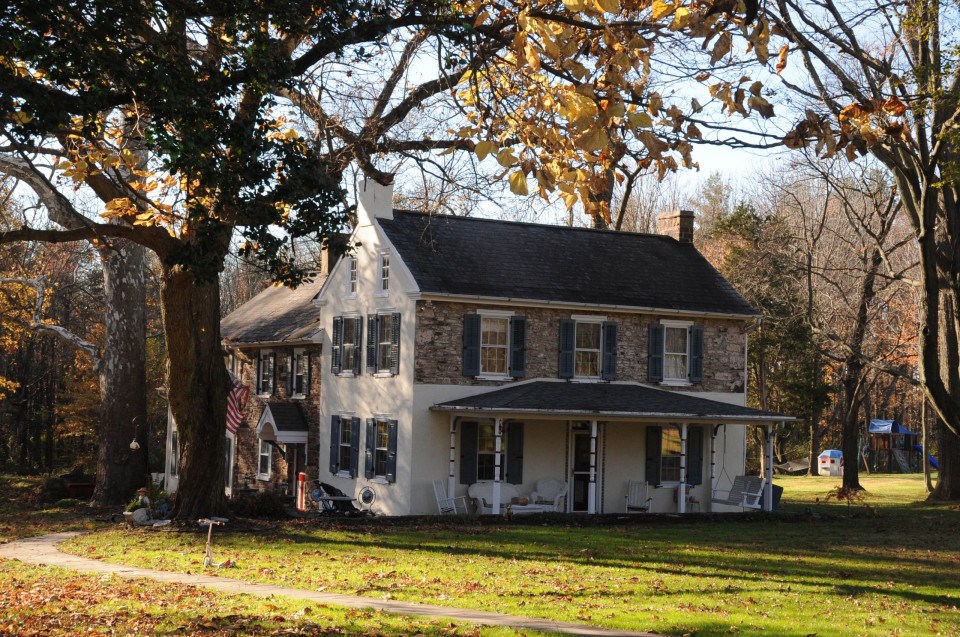
1. Gladwyne, Main Line
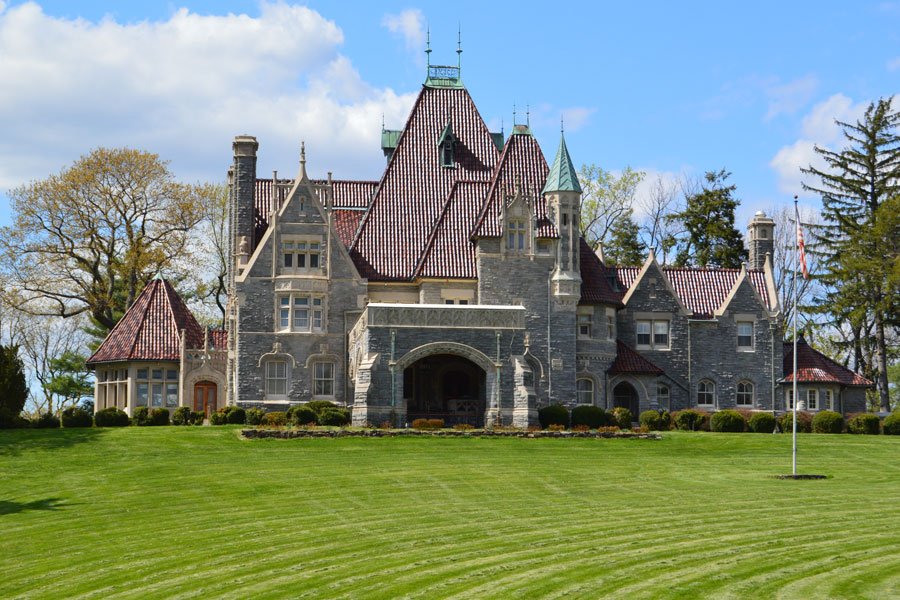
The Woodmont estate is a National Historic Landmark in Gladwyne, one of the most expensive neighborhoods around Philly. / Photograph by Flickr/Montgomery County Planning Commission
2022 Average Price: $1,770,195
One-Year Change: 12%
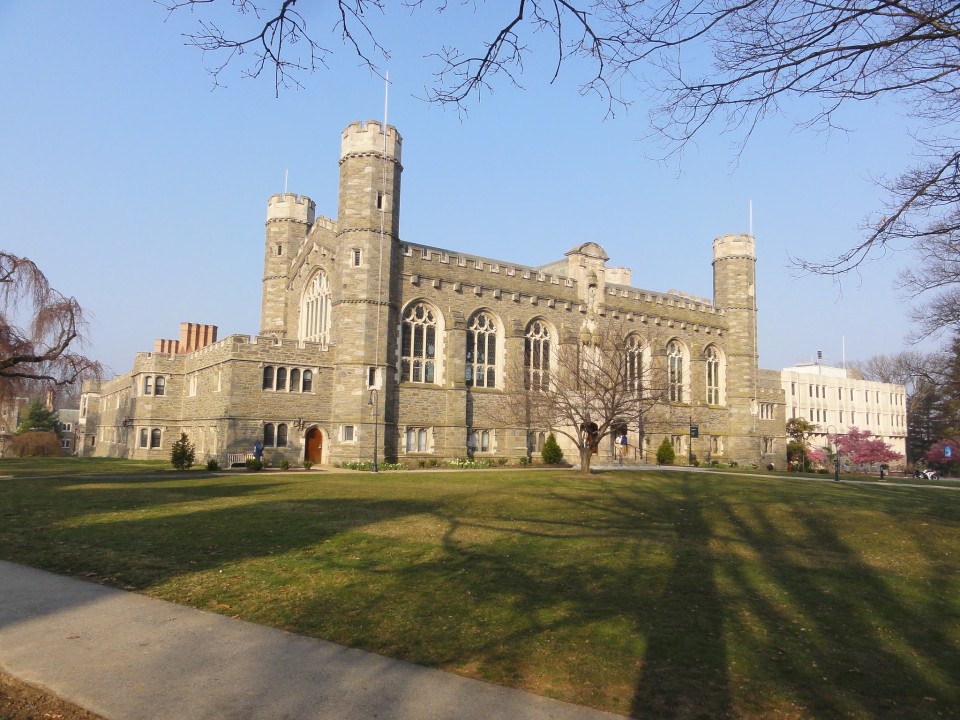
2. Villanova, Main Line
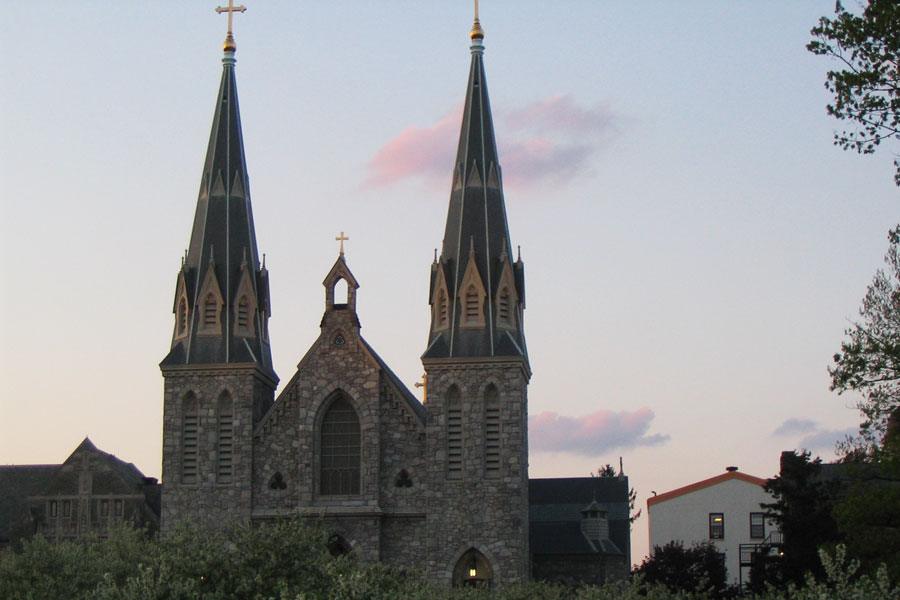
St. Thomas of Villanova Church is a landmark of Villanova, one of the most expensive neighborhoods around Philadelphia. / Photograph by Flickr/justinknabb
2022 Average Price: $1,405,133
One-Year Change: 8%
3. New Hope Borough, Bucks

New Hope / Photograph by John Herr
2022 Average Price: $1,160,995
One-Year Change: 21%
4. Easttown Township, Chester
The Devon Horse Show takes place in Easttown Township. / Photograph by Flickr/MissTessmacher
2022 Average Price: $1,127,221
One-Year Change: 13%
5. Upper Makefield Township, Bucks
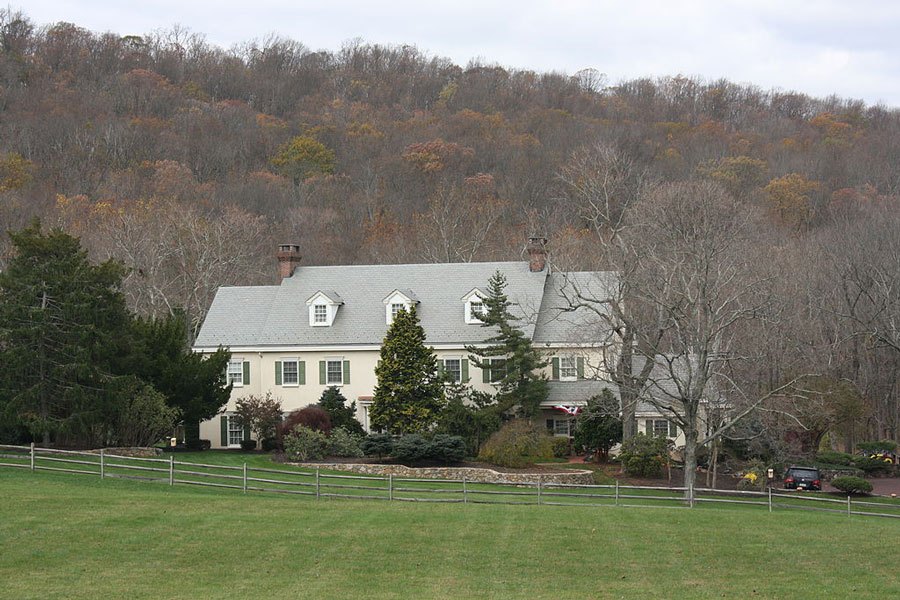
The Keith House in Upper Makefield Township / Photograph via Wikimedia Commons/Shuvaev
2022 Average Price: $1,061,983
One-Year Change: 5%
6. Radnor Township, Delaware
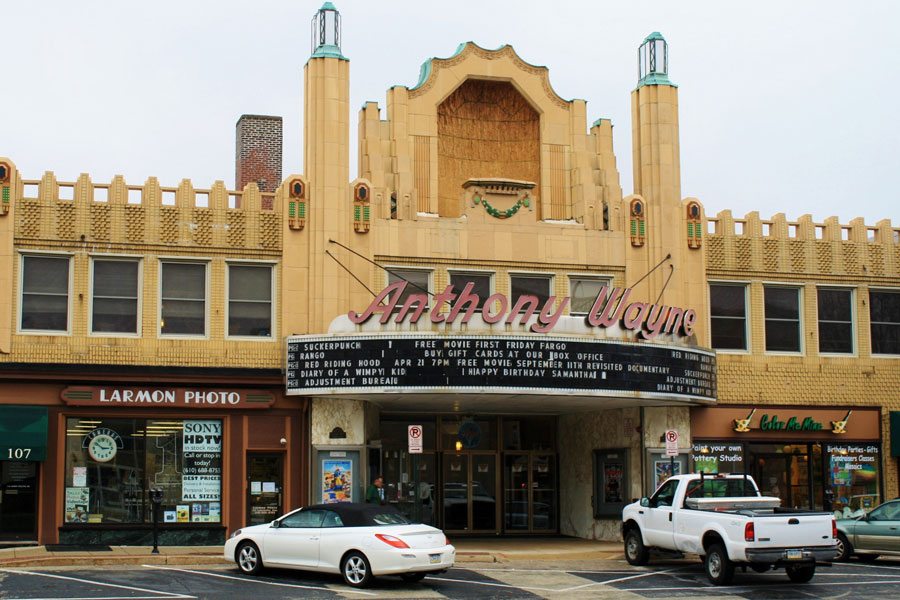
The Anthony Wayne Theatre is located in Wayne in Radnor Township. / Photograph by Flickr/chrisinphilly5448
2022 Average Price: $991,120
One-Year Change: 18%
7. Solebury Township, Bucks
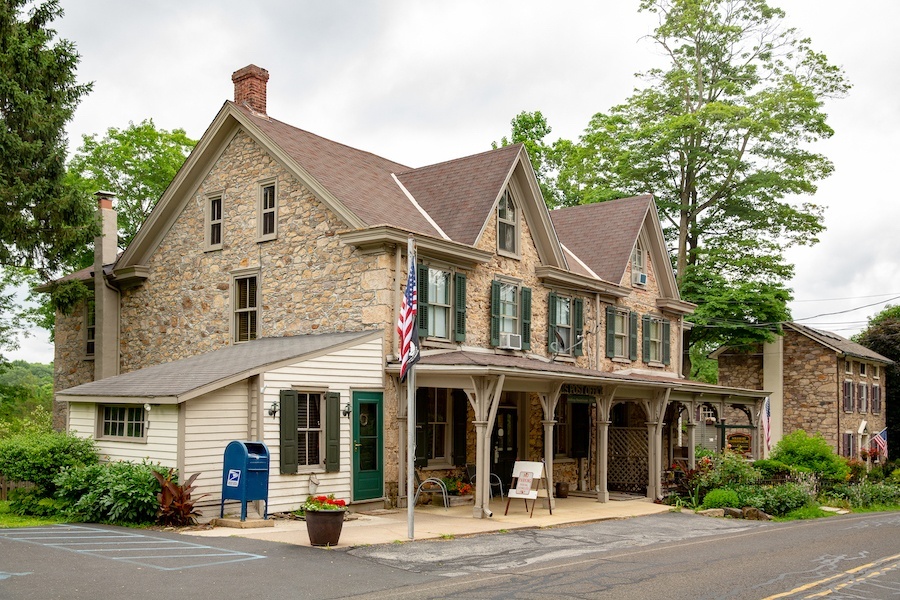
The Solebury post office is attached to this historic house. / Photograph courtesy Addison Wolfe Real Estate
2022 Average Price: $990,518
One-Year Change: 2%
8. Wrightstown Township, Bucks
Vansant Farmhouse in Wrightstown Township / Photograph by Jerrye & Roy Klotz via CC BY-SA 3.0
2022 Average Price: $947,818
One-Year Change: 12%
9. Edgmont Township, Delaware

Ridley Creek State Park in Edgmont Township
2022 Average Price: $901,652
One-Year Change: 29%
10. Bryn Mawr, Main Line
Bryn Mawr College / Photograph by Bart Everson
2022 Average Price: $893,771
One-Year Change: 5%
11. Merion Station, Main Line
2022 Average Price: $890,852
One-Year Change: -3%
12. Chestnut Hill (19118), Philadelphia
2022 Average Price: $889,146
One-Year Change: -3%
13. Lower Merion Township, Montgomery
2022 Average Price: $868,732
One-Year Change: 5%
14. Pennsbury Township, Chester
2022 Average Price: $865,130
One-Year Change: 8%
15. Lower Gwynedd Township, Montgomery
2022 Average Price: $853,410
One-Year Change: 5%
16. Tinicum Township, Bucks
2022 Average Price: $851,544
One-Year Change: 19%
17. Haddonfield Borough, Camden

Designed by Krieger and Associates, this Haddonfield manse sits on nearly three and a half acres and overlooks the fairways of Tavistock Country Club. Featuring two gabled pavilions connected in the center by a double-height family room, the home also includes a swimming pool and a multi-use sports court. / Photograph by Jeffrey Totaro
2022 Average Price: $833,018
One-Year Change: 19%
18. Willistown Township, Chester
2022 Average Price: $825,557
One-Year Change: 8%
19. Newtown Borough, Bucks
2022 Average Price: $824,468
One-Year Change: 13%
20. Newlin Borough, Chester
2022 Average Price: $823,758
One-Year Change: -25%
21. Charlestown Township, Chester
2022 Average Price: $817,730
One-Year Change: 13%
22. Wayne, Main Line
2022 Average Price: $817,033
One-Year Change: 5%
23. Pocopson Township, Chester
2022 Average Price: $793,865
One-Year Change: 5%
24. West Vincent Township, Chester
2022 Average Price: $783,740
One-Year Change: 21%
25. Thornbury Township, Chester
2022 Average Price: $781,431
One-Year Change: 15%
26. Thornbury Township, Delaware
2022 Average Price: $776,865
One-Year Change: 14%
27. Devon, Main Line
2022 Average Price: $775,345
One-Year Change: -6%
28. Birmingham Township, Chester
2022 Average Price: $760,313
One-Year Change: 4%
29. Rose Valley Borough, Delaware
2022 Average Price: $752,375
One-Year Change: 0%
30. East Nantmeal Township, Chester
2022 Average Price: $732,929
One-Year Change: 14%
31. Moorestown Township, Burlington
2022 Average Price: $731,364
One-Year Change: 12%
32. Rittenhouse (19103), Philadelphia
2022 Average Price: $726,648
One-Year Change: -10%
33. Buckingham Township, Bucks
2022 Average Price: $724,250
One-Year Change: 8%
34. Upper Providence Township, Delaware
2022 Average Price: $724,104
One-Year Change: 22%
35. Newtown Township, Delaware
2022 Average Price: $708,890
One-Year Change: 6%
36. Wynnewood, Main Line
2022 Average Price: $699,599
One-Year Change: 19%
37. Narberth Borough, Montgomery
2022 Average Price: $692,526
One-Year Change: 8%
38. Kennett Township, Chester
2022 Average Price: $692,449
One-Year Change: 16%
39. West Goshen Township, Chester
2022 Average Price: $689,376
One-Year Change: 13%
40. Worcester Township, Montgomery
2022 Average Price: $680,706
One-Year Change: 15%
41. East Bradford Township, Chester
2022 Average Price: $673,608
One-Year Change: 27%
42. Swarthmore Borough, Delaware
2022 Average Price: $671,842
One-Year Change: 30%
43. West Pikeland Township, Chester
2022 Average Price: $666,389
One-Year Change: -12%
44. Old City/Society Hill (19106), Philadelphia
2022 Average Price: $659,174
One-Year Change: 0%
45. Doylestown Borough, Bucks
2022 Average Price: $659,112
One-Year Change: 14%
46. Center City West (19102), Philadelphia
2022 Average Price: $654,693
One-Year Change: 4%
47. Wallace Township, Chester
2022 Average Price: $652,998
One-Year Change: 16%
48. Whitpain Township, Montgomery
2022 Average Price: $646,354
One-Year Change: 5%
49. Northampton Township, Bucks
2020 Average Price: $634,062
One-Year Change: 21%
50. Whitemarsh Township, Montgomery
2022 Average Price: $634,041
One-Year Change: 7%
*Data derived from HomExpert Market Report, a product of the Berkshire Hathaway HomeServices Fox & Roach Research Division. The information is based on MLS data and deemed accurate but not guaranteed. Percentages have been rounded to the nearest whole number.