
Morning Headlines: Which Neighborhoods Are Hot, and Which Are Not?
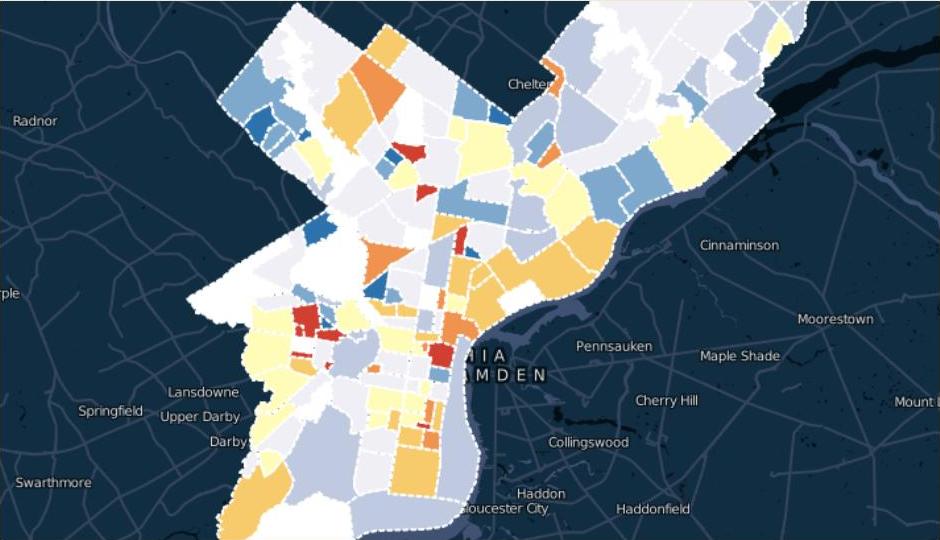
Screenshot of Gentrifying Philly map via Technical.ly Philly.
Code for Philly — a community of web developers and “hacker citizenry, dedicated to re-imagining City government through civic apps” –has a new map showing which Philadelphia neighborhoods have seen an increase and decrease in new projects between 2007 and 2013.
It’s an interesting visual of sections of the city experiencing change, but the map offers some results that might seem unexpected. Jim Smiley, the map’s developer, gives the example of Brewerytown: In 2012, construction permits numbered at 265. The next year, 131 new permits were filed. Percentage-wise, the drop was 50%, making the neighborhood go from being colored red hot (a sign of revitalization) to a dim blue (little to none). But Brewerytown is still seen as a neighborhood in transition, isn’t it?
Below is a table of the neighborhoods with the most construction permits in 2013.
• Gentrifying Philly: This map shows neighborhoods undergoing change [Technical.ly Philly]
More headlines this way…
• Kimpton proposal for Family Court praised and knocked [Inquirer]
• Revzilla adds larger building at Navy Yard [PhillyDeals]
• Commercial Development Brings More Demand For Residential Properties In Logan Square [CBS Philly]
• Commission wants more time to consider Blackwell’s two-story building limit [PlanPhilly]
• Why rising rents are not bad for tenants [Philadelphia Business Journal]

