
A Map of Obesity in Philadelphia
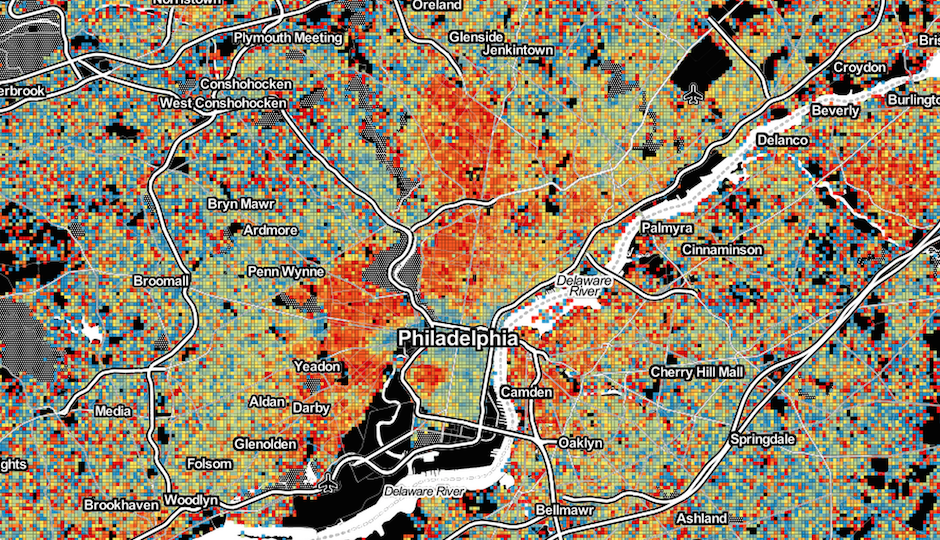
Map by RTI International
Philadelphia has the second-highest rate of obesity among the 10 counties containing the nation’s largest cities, according to a 2009 report by the U.S. Centers for Disease Control and Prevention. More than 68 percent of adults — and 41 percent of children between the ages of 6 and 17 — are overweight or obese.
Obesity is a more serious concern in certain parts of the city than in others. In North Philly, for instance, the CDC found that nearly 70 percent of kids are overweight or obese. That’s almost double the national average.
The nonprofit RTI International put together a map showing where obesity is more prevalent in Philadelphia and other regions. In the image above, redder colors signify higher rates of obesity among the adult population, while bluer colors indicate lower rates.
Large parts of North Philly, Northwest Philly, West Philly and Southwest Philly are orange and red, making clear just how much of an issue this is for Philadelphia in general.
Bill Wheaton, director of RTI’s Geospatial Science and Technology Program, said in a statement that many of the policies that would be the most effective at reducing obesity rates take place at the neighborhood level.
“Working with our federal and university partners to convert these data into decisions and policies that reduce obesity is our No. 1 priority,” he said.
Another layer of RTI’s map (see below) show the parts of the city where the obesity rate is higher than the national average. The warmer the colors, the more likely an area’s high obesity rate is statistically significant and “not a result of random chance,” said RTI.
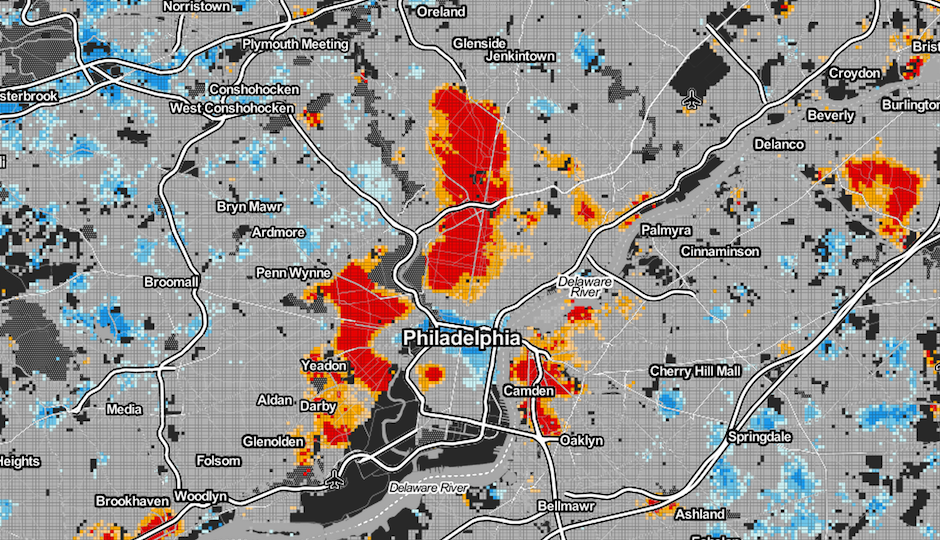
Map by RTI International