4.9 Million Philadelphia Parking Tickets Since 2012

4.9 million tickets, and counting.
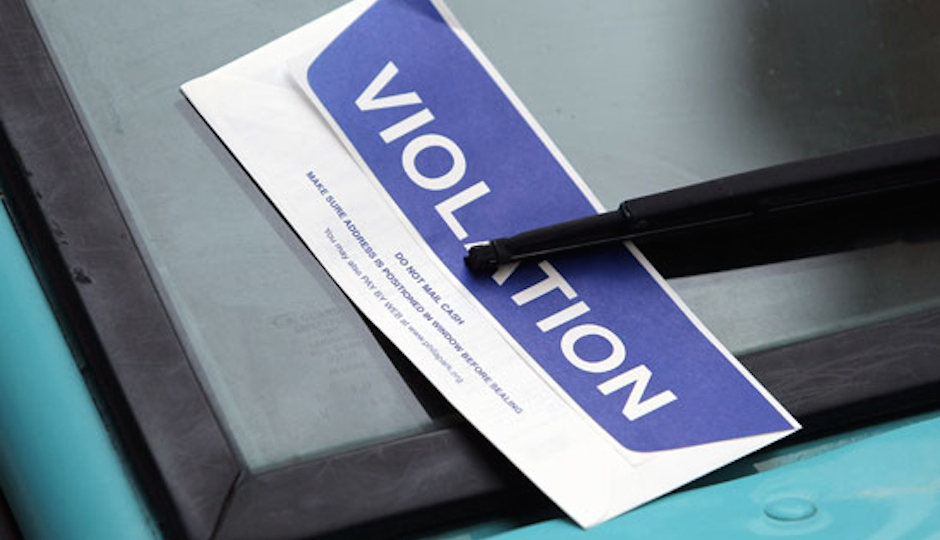
The City of Philadelphia just released a massive and fascinating new data set that includes every single parking ticket issued in the city since 2012. And there are a lot: just about 4.9 million of ’em. But the data goes way beyond a raw count. Each row includes the location of the ticket, the time of day, the penalty amount, the violation type — you get the idea.
With analysis, this data trove should shed some new meaningful new light on how motorists use the road, and how city agencies and the state-run Philadelphia Parking Authority regulate street parking. The release couldn’t come at a better time. Philadelphians have begun to question if it really makes sense to allocate so much street real estate to parked vehicles, in favor of other uses like wider sidewalks, bike lanes or small parks.
We’re going to dive into this in the weeks to come, but until we do, here are five quick takeaways from the city’s release, which already includes some very illuminating maps and top-level analysis.
- Parking enforcement is toughest right where you’d expect it to be: core Center City and University City. But it’s also pretty tough on commercial corridors well outside of Center City. Some 42,000 tickets have been written around 52nd Street in West Philly since 2012. Enforcement is tough around Temple University, which makes sense, but the Parking Authority is pretty ruthless further north on Broad as well. In Southwest Philly, Woodland Avenue and Springfield Avenue are hotspots. Make sure you don’t short the meter in Frankford, either.
- Never, ever, ever-ever-ever-ever tempt the parking gods on Market Street, especially west of City Hall. You will lose.
- Citywide, parking enforcement looks to be pretty flat since 2012. There are some seasonal peaks and valleys, and perhaps a gradual downward decline in tickets issued, but nothing dramatic.
- More than 85,000 idiots parked too close to a fire hydrant since 2012. Another 2,300 or so were ticketed for parking on grass, and 31,000 thought they could get away with parking in crosswalks. But the far and away most frequent violation was the old expired meter, which accounted for about two million of the tickets.
- Some drivers rack up a lot of tickets. The city’s data release doesn’t include license plate numbers, but it does include an anonymized identifier linked to each individual license plate. Whoever drives you, vehicle number 1657934, needs to get their shit together: 1,041 violations in less than three years? Really?
More broadly, bravo to the Nutter administration for making this data public. I know firsthand the Parking Authority has been loath to give it up, at least in the past. But this is what the open data movement is all about: making public the work product of government, in the hopes that doing so will improve government performance and lead to a better understanding of the city. This dataset has huge potential to do both.