
Zillow: Condo Values Booming Nationwide, Outpacing Single-Family Homes

Gorgeous. | Shutterstock.com
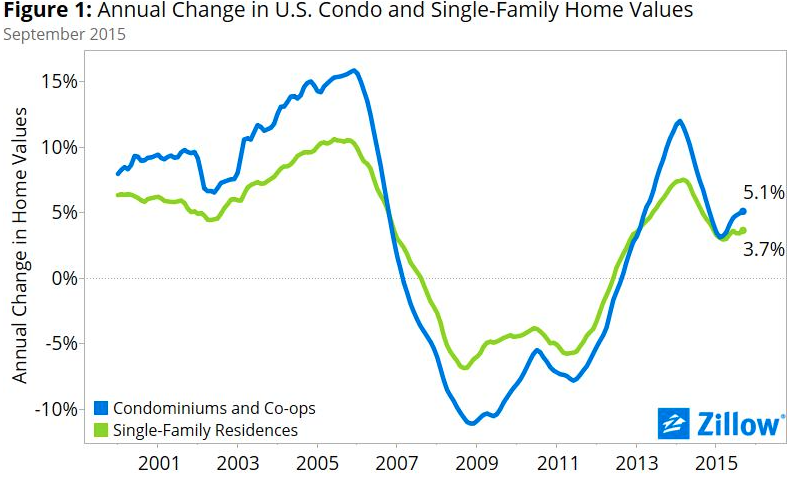
A new report from real estate behemoth Zillow shows that condominium values have shot way up across the country, especially in the rapidly growing urban tech and energy strongholds in California, Texas and New York. What’s more, they’re appreciating faster than single-family homes–5.1% compared to 3.7%, nationally. That’s no small feat, considering the bottom completely fell out of the condo market during Great Recession, when owners across the nation saw values plummet by an average of over 33%.
While Philadelphia is beginning to position itself as a tech-centric market with mega-developments like the Comcast Innovation and Technology Center, the Pennovation Center and uCity Square, the numbers don’t match up to the more established cities in this field, but they’re growing. What’s clear is that condos are back in a big way, rents are rising and it might just be a damn good time to buy a home for a good price.
Let’s take a quick look at the data.
According to the report, condos are appreciating faster than single-family homes in nearly two-thirds of the top 35 most populated housing markets, as millennials and empty nesters seek out urban lifestyles, albeit probably on opposite sides of the market.
In Philadelphia, the third quarter value of a condo averages $118,200, which represents a bump of 2.3% year-over-year. On the flip side, the $226,800 value of single family homes represents a -0.4% dip during the same timeframe.
Overall, six of the 35 metros saw condo values appreciate by over 10% in the past year, led by Dallas-Fort Worth, which saw numbers rise by a staggering 20.1%, according to the report. Throw in the gains seen in Houston (13.6%), San Antonio (7.8%) and Austin (8.2%), and you can see that everything really is bigger in Texas, including condo values.
Tech bastions like San Francisco (13.5%), San Jose (13.0%), Seattle (10.5%) and New York/Northern New Jersey (8.3%) also saw major gains on the condo side of the ball.
Denver’s housing market is crushing it across the board, with condo and single-family values appreciating at 19.7% and 15.9%, respectively. Rent prices have soared in the Mile High City by 11.5%, or just a shade under $2,000 per month according to Zillow’s Rental Index. Still, that’s nothing compared to the woes of renters in the Bay Area, where average rents are soaring above $3,300 per month.
“The housing bust hit condo values hard, and over the past few years, buying a condo wasn’t always considered a good investment compared to a single family home,” said Zillow Chief Economist Dr. Svenja Gudell, in the release. “But that’s changing, and condos increasingly represent a strong-performing, often affordable choice, particularly for first-time buyers interested both in homeownership and in keeping a lower-maintenance, city lifestyle.
But there’s good news for those of you looking to buy a home. Philly’s Zillow Rental Index is $1,585 per month, and the seemingly stagnant value of homes compared to condos, which are in limited supply, means that you might have an easier time finding a great home in one of Philly’s amazing neighborhoods.
According to a recent BHHS Fox & Roach HomExpert Market Report, Greater Philadelphia homes sales reached to their highest point in four years, increasing by 14.5% over the first nine months of 2015. Philadelphia County alone saw nearly 11,500 homes sales in the time span, and the average days on market is down since 2014 as well. So, while we might not be Denver, Philly’s housing market looks to be doing just fine.
Here’s the full chart from Zillow:
| Metro Area | Condo ZHVI[ii] | YoY change in condo ZHVI | Single-family home ZHVI | YoY change in single-family home ZHVI | ZRI[iii] | ZRI YoY change |
| United States | $191,300 | 5.1% | $181,500 | 3.7% | $1,386 | 3.7% |
| New York-Northern New Jersey | $505,900 | 8.3% | $371,100 | 1.1% | $2,405 | 4.1% |
| Los Angeles, CA | $439,800 | -0.2% | $579,100 | 5.6% | $2,529 | 4.1% |
| Chicago, IL | $160,500 | 2.8% | $201,700 | 1.2% | $1,645 | 0.5% |
| Dallas-Fort Worth, TX | $137,300 | 20.1% | $174,200 | 14.9% | $1,502 | 5.1% |
| Philadelphia, PA | $118,200 | 2.3% | $226,800 | -0.4% | $1,585 | 2.0% |
| Houston, TX | $108,900 | 13.6% | $170,000 | 9.0% | $1,570 | 5.8% |
| Washington, DC | $295,200 | 0.2% | $394,100 | -0.9% | $2,113 | 1.8% |
| Miami-Fort Lauderdale, FL | $150,700 | 8.5% | $279,500 | 8.8% | $1,810 | 2.5% |
| Atlanta, GA | $143,600 | 8.7% | $166,000 | 5.4% | $1,302 | 5.7% |
| Boston, MA | $304,400 | 8.8% | $398,000 | 4.9% | $2,271 | 6.8% |
| San Francisco, CA | $575,200 | 13.5% | $805,300 | 12.0% | $3,348 | 13.3% |
| Detroit, MI | $150,200 | 6.9% | $114,700 | 6.2% | $1,124 | 5.8% |
| Riverside, CA | $227,700 | 3.0% | $300,200 | 5.7% | $1,699 | 3.3% |
| Phoenix, AZ | $136,500 | 6.8% | $222,300 | 6.9% | $1,277 | 5.3% |
| Seattle, WA | $275,800 | 10.5% | $376,400 | 8.0% | $1,936 | 7.7% |
| Minneapolis-St Paul, MN | $153,300 | 4.8% | $224,100 | 3.2% | $1,529 | 1.7% |
| San Diego, CA | $357,200 | 6.4% | $523,300 | 5.5% | $2,347 | 3.8% |
| St. Louis, MO | $122,400 | 6.3% | $140,600 | 6.8% | $1,159 | 5.0% |
| Tampa, FL | $101,000 | 8.8% | $168,200 | 7.5% | $1,311 | 4.5% |
| Baltimore, MD | $187,500 | -2.3% | $246,200 | -1.7% | $1,728 | 2.2% |
| Denver, CO | $200,700 | 19.7% | $338,600 | 15.9% | $1,964 | 11.5% |
| Pittsburgh, PA | $130,000 | 3.3% | $124,900 | 1.4% | $1,103 | -3.8% |
| Charlotte, NC | $139,800 | 3.6% | $159,300 | 4.0% | $1,226 | 5.1% |
| Sacramento, CA | $205,800 | 7.5% | $343,700 | 6.1% | $1,676 | 6.6% |
| San Antonio, TX | $111,400 | 7.8% | $161,200 | 6.4% | $1,356 | 4.0% |
| Orlando, FL | $98,600 | 7.5% | $190,400 | 6.2% | $1,351 | 3.5% |
| Cincinnati, OH | $98,000 | 1.3% | $142,900 | 2.6% | $1,257 | 5.1% |
| Cleveland, OH | $91,400 | 5.9% | $127,500 | 2.8% | $1,166 | 1.1% |
| Las Vegas, NV | $112,700 | 9.3% | $214,000 | 7.4% | $1,226 | 3.5% |
| Columbus, OH | $104,200 | 4.0% | $159,400 | 5.3% | $1,290 | 3.4% |
| Indianapolis, IN | $108,800 | 2.0% | $130,000 | 3.7% | $1,189 | 1.7% |
| San Jose, CA | $637,000 | 13.0% | $984,800 | 12.9% | $3,422 | 9.1% |
| Austin, TX | $211,100 | 8.2% | $246,300 | 9.9% | $1,720 | 5.2% |


